

Trading Days Remaining Until Options Expiration
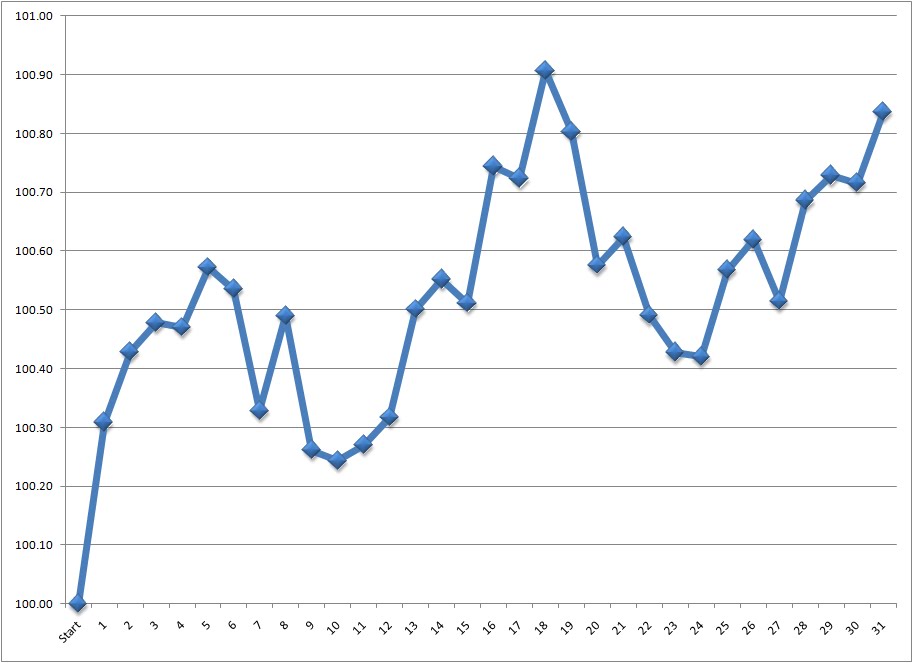
Here is a chart that shows the historical performance of the S&P 500, given the number of trading days remaining until near-month options expire (from 1990 to 2010).
The first chart groups low-frequency days together (21 to 24 days remaining and 19 to 20 days remaining are grouped together as single observations because some months are shorter than others). The second chart does not group low-frequency days together.
1 comment:
I know this was posted over a month ago however I have a question. First off, what is the Y value on all your charts? Secondly I was considering approaching only getting into options one month out, a week before the current months expiration. It makes sense in my head although its hard to explain. As an example,
On this last Monday, the 16th of May I entered into several positions for June 11, I'm fairly new at this but my plan is to just stay in during the week of the current month expiration and then exit on Friday. I just did this with EXPE and made a 4 bagger then got out a little early. I believe thats what your chart is displaying as well. Let me know your thoughts or if you even get this. If you could reply to my email that would be swell
ChadMissa@gmail.com
Post a Comment