

Trading Days Remaining Until Month End
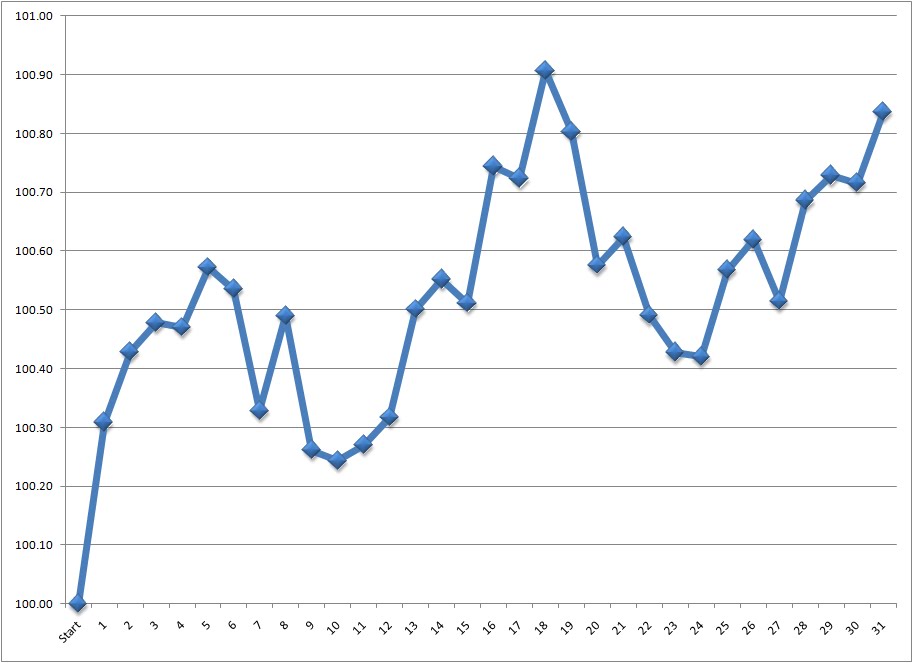
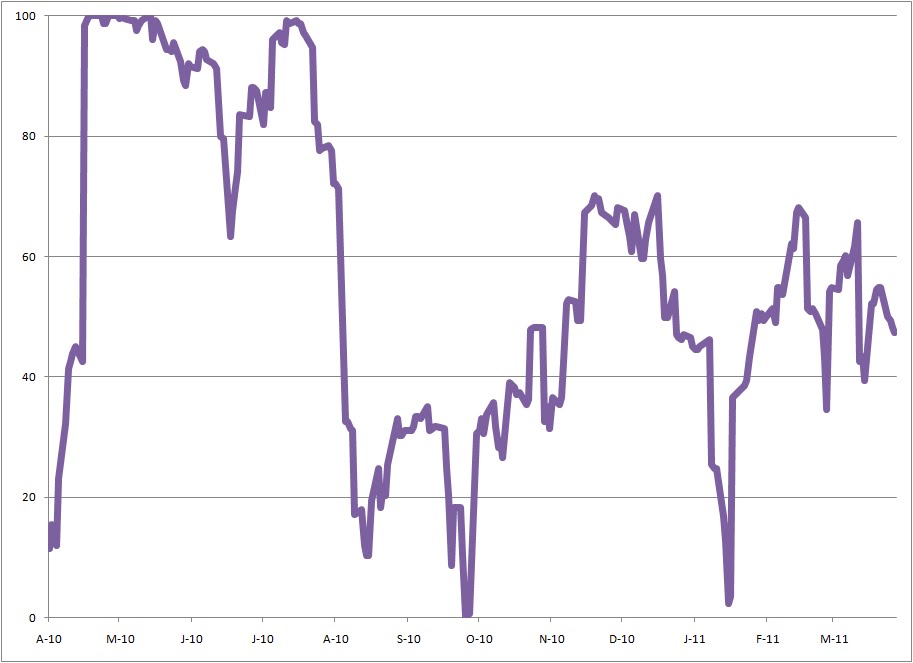
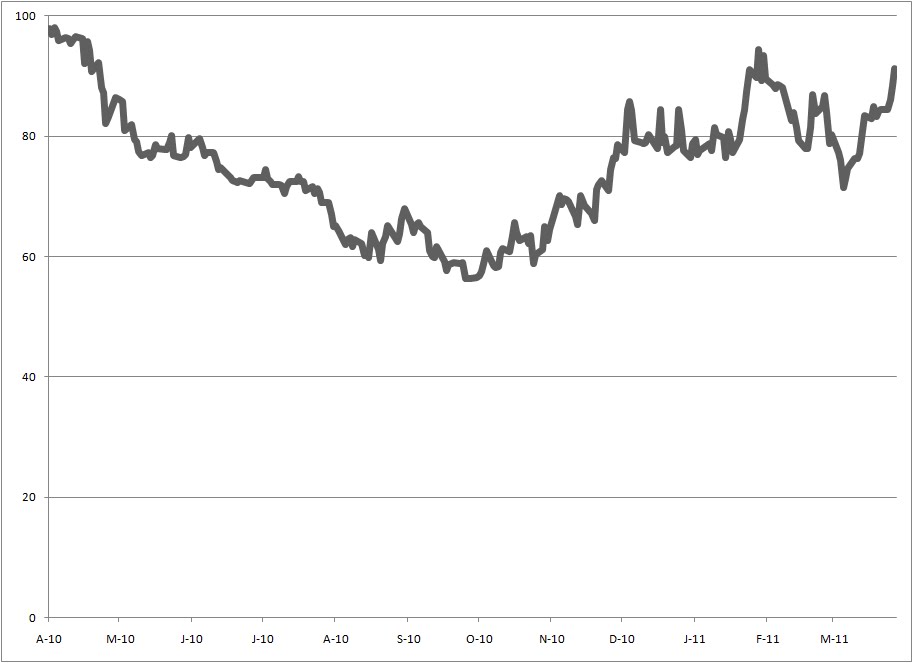
Here is a chart that shows the historical performance of the S&P 500, given the number of trading days remaining until the end of the month (from 1990 to 2010).
The first chart groups low-frequency days together (21 to 22 days remaining is grouped together as a single observation because some months are shorter than others). The second chart does not group low-frequency days together.


